 www.geodatenkatalog.de (S2L)
Contact for the resource
Bundesanstalt für Geowissenschaften und Rohstoffe
272 record(s)
Provided by
Type of resources
Available actions
Topics
Keywords
Contact for the resource
Update frequencies
Service types
-
The HÜK250 (INSPIRE) describes the hydrogeological characteristics of the upper continuous aquifers in Germany at a scale of 1:250,000. According to the Data Specification on Geology (D2.8.II.4_v3.0) the map provides INSPIRE-compliant data. The hydrogeologic units are represented graphically – mostly according to the INSPIRE portrayal rules – by GE.Aquifer.MediaType, GE.Aquifer.HydrogeochemicalRockType, GE.Aquifer.permeabilityCoefficient (BGR colours), GE.Aquitard.approximatePermeabilityCoefficient (BGR colours), GE.Aquitard and GE.Aquiclude.ConstitutionOfAquiclude. The geologic units are represented graphically – according to the INSPIRE portrayal rules – by GE.GeologicUnit.AgeOfRocks and GE.GeologicUnit.Lithology. The HÜK250 is a joint project of the SGD under the leadership of the BGR.
-

The World-wide Hydrogeological Mapping and Assessment Programme (WHYMAP) provides data and information about the earth´s major groundwater resources. The Groundwater Resources Map shows various characteristic groundwater environments in their areal extent and classified by their aquifer productivity and recharge potential. Additional groundwater related features such as wetlands and areas of low rainfall are included in the dataset.
-
The World-wide Hydrogeological Map Information System (WHYMIS) offers information on the availability of hydrogeological and other groundwater related maps at national (country) and international (continent) level.
-
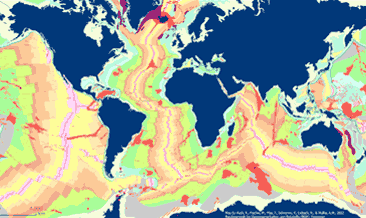
The General Global Map of Seafloor Bedrock Geology (seafloorgeol) shows the global distribution of seafloor bedrock, the boundaries of the continental shelf and continental slope, the axes of the oceanic ridges and other marine geological features. Sedimentary deposits are not shown. The map is based on extracts from Bouysse et al. (2010) © CGMW, and Bryan & Ernst (2008) using Esri Basemap, HERE, Garmin, FAO, NOAA, USGS, © OpenStreetMap contributors and the GIS User Community.
-
The HÜK250 (INSPIRE) describes the hydrogeological characteristics of the upper continuous aquifers in Germany at a scale of 1:250,000. According to the Data Specification on Geology (D2.8.II.4_v3.0) the content of the map is stored in a INSPIRE-compliant GML file: HUEK250.gml. The GML file together with a Readme.txt file is provided in ZIP format. The Readme.txt file (German/English) contains detailed information on the GML file content. Data transformation was proceeded by using the INSPIRE Solution Pack for FME according to the INSPIRE requirements.
-
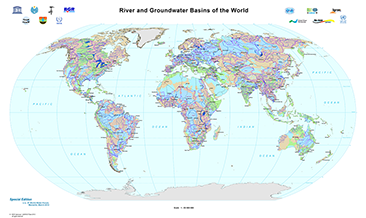
The World-wide Hydrogeological Mapping and Assessment Programme (WHYMAP) provides data and information about the earth´s major groundwater resources. The River and Groundwater Basins Map shows the areal extent of the global groundwater and surface water basins.
-
The German Earthquake Catalogue is based on a database providing information on the seismicity in Germany an adjacent areas. It contains locations of seismic events since year 800 where their epicentre determinations are based on historical sources as well as on measurements at seismometer stations since the start of instrumental seismological recording in the 20th century. Today, digital data acquisition at seismometer stations of the German regional seismic network (GRSN), the seismic GERES array, and the Gräfenberg array (GRF) takes place. All events with a local magnitude ML 2.0 and higher are listed. The GML file together with a Readme.txt file are provided in ZIP format (GERSEIS-INSPIRE.zip). The Readme.text file (German/English) contains detailed information on the GML file content. Data transformation was proceeded by using the INSPIRE Solution Pack for FME according to the INSPIRE requirements. Due to the continuous processing of the seismic events, the INSPIRE dataset is updated annually.
-
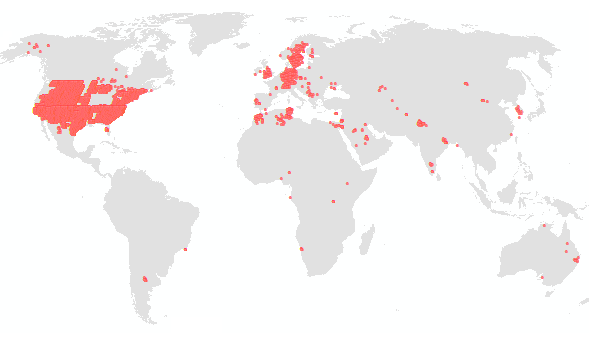
Considering water as the primary resource necessary for social life, agriculture, industry, and wealth, the importance of groundwater investigation is clear. Apart from many other pollutants, this work focusses on geogenic uranium (U) and radium (Ra), which both stand for natural radionuclides (NORM) that need to be considered frame of groundwater exploration and monitoring programmes due to their specific mobility and chemo-/radiotoxicity. As investigation of U and – to a lesser extent - Ra is done by an increasing number of scientific working groups, the global dataset is improving continuously. In order to give a summarized overview on available and recent literature, scientific papers, reports, and governmental documents have been reviewed for U-238 mass concentrations and Ra-226 and Ra-228 activity concentrations and collected in tables and global maps. Further natural isotopes of U and Ra have been rarely subject of investigation. The collected data were evaluated and interpreted in frame of an associated scientific publication (see citation). From the available data it can be concluded that high geogenic U occur mainly under oxidizing conditions and carbonate rich groundwater, which might be seen as indicator for elevated U concentrations. Certain geological formations, as for example sedimentary, granitic, and volcanic host rocks, promote high U concentrations in groundwater. For geogenic Ra, the search for definite indications proved difficult, since less clear correlation is given for any observed factor. In a global perspective, the most promising evidence for elevated Ra are highly reducing redox conditions, as well as the occurrence of Fe/Mn mineral phases. Furthermore, barite represents a sink for Ra due to its ability to incorporate Ra isotopes. Dissolution of those mineral phases eventually results in co-dissolution of Ra, when Ra is found in host rocks of investigated aquifers, or downstream of such groundwater reservoirs. Furthermore, cation exchange might enhance Ra mobility process, especially in case of sedimentary aquifers with low sorption capacity and/or aquifers with high salinity. Given those chemical requirements for the occurrence of U and Ra, a negative correlation between mother and daughter nuclide can be established. When knowledge on present geological and geochemical constraints is available, elevated U and Ra concentrations might be predictable, as long as anthropogenic influence is excluded.
-
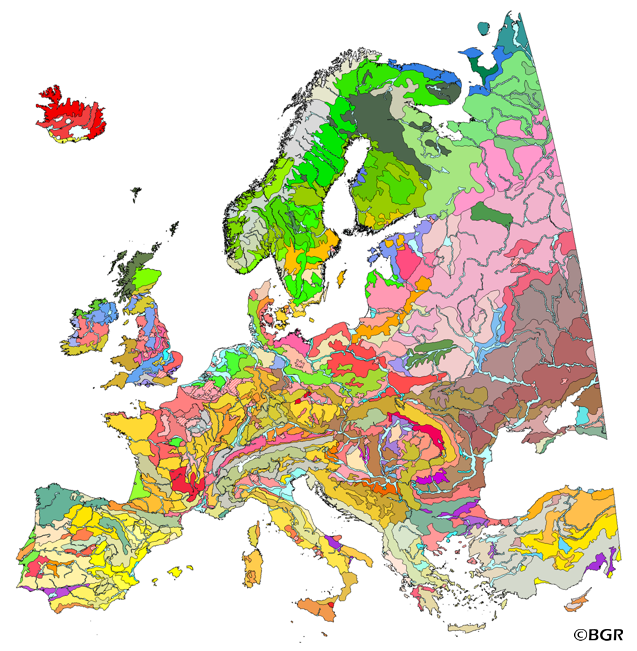
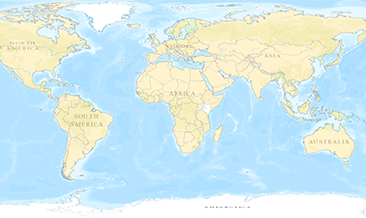
The map of the "Soil Regions of the European Union and Adjacent Countries 1:5,000,000 (Version 2.0)" is published by the Federal Institute of Geosciences and Natural Resources (BGR), in partnership with the Joint Research Center (JRC, Ispra). The soil regions map is intended to support the current national mapping activities towards a European 1:250,000 datbase by stratifying similar regional soil associations into a hierarchical concept. Only by stratification, the complexity of soils can be systematically structured so that the complex 1:250,000 legend can be handled in cross-national and contintental-level applications. Soil regions are natural, cross-regional soil geographical units which perform the highest spatial and content-based aggregation of European soils. They represent the frame conditions for soil development at the landscape level. The soil regions are presented at scale 1:5,000,000. Thus, its borders are highly generalized. Because of its low resolution, the map units absorb atypical soils and associations of soils, which are only described in higher resolution soil maps. The delineation of the soil regions is expected to be refined (and probably improved by its content) during the actual 1:250,000 mapping process. Thus, updating can be expected in the future. Currently, the soil regions map is the only graphical soil representation in Europe which has been developed using fully comparable and harmonized basic data at the continental level (climate, hydrography, relief, geology, vegetation): the interpretation of this input data, and the utilization of expert knowledge (including the interpretation of regional soil maps) has been done using one common methodology, developed and applied consistently throughout the whole mapping area by an experienced international soil mapper (Dr. Reinhard Hartwich, former member of BGR, and co-author of the 1998 Manual of Procedures). The methodology is extensively described in the Explanatory Notes (German), and in the revised Manual of Procedures which is expected to be completed soon. It is highly recommended to apply and interpret the map using the map comments and descriptions as provided in the explanatory notes (German: Hartwich et al. 2005; English: revision of the Manual of Procedures, initial version: Finke et al. 2001).
-
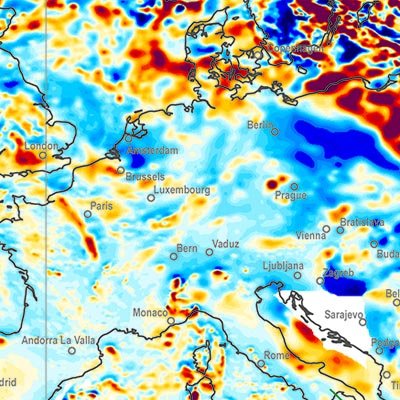
A global Earth Magnetic Anomaly Grid (EMAG2) was compiled from satellite, ship and airborne magnetic measurements. (Maus et al., 2009) Over the continents and the Arctic we made use of exisiting magnetic anomaly grids, whereas original ship and airborne trackline data were processed over the rest of the oceans, wherever available. CHAMP satellite magnetic measurements provided the magnetic field at wavelengths above 330 km. The EMAG2 grid is available at http://geomag.org and http://ngdc.noaa.gov. Directional gridding Due to the sparsity of magnetic field measurements in the southern oceans, it is necessary to interpolate the magnetic field between tracklines. Our interpolation algorithm takes the direction of the magnetic lineations into account. Tje lineations are parallel to the isochrons, which are perpendicular to the gradient of the age of teh oceanic crust. We use the age grid of Müller et al. (2008). The magnetic field ad a given grid point is computet by Least Squares Collocation from the surrounding measurements. If the point is on land, we use an isotropic correlation function with Rc = 14 km correlation length. Over the oceans we use Rc = 56 km parallel to the isochrons and Rc = 14 km in the spreading direction. Measurements seperated from the grid point by an age discontinuity or a topographic feature are excluded from the collation.